When I compiled the Top Gray Rhinos of 2017 list early this year, I noted that concerns about financial market shocks had fallen to fifth among the things keeping risk analysts up at night. I speculated that perhaps market worries simply were wrapped in among pressing concerns about the United States, Europe, and China’s politics and economies, the top three worries on the list.
Revisiting those risks as the third quarter draws to an end, I’d say market worries have catapulted to the top, though you would be hard pressed to see it in the behavior of financial exchanges.
The Dow Jones Industrial Average continues to dance with new record highs above 22,000 since hitting that milestone on August 2.
The cyclically adjusted price earnings (better known a CAPE) ratio, an indicator of relative height of stock prices, is hovering above 30, nearly twice its historical average of 16.81. As Robert Shiller, its co-creator, pointed out over the weekend: “It has been above 30 in only two other periods: in 1929, when it reached 33, and between 1997 and 2002, when it soared as high as 44.” Yet he noted that a key psychological factor is driving the market: “While valuations remain very high there just doesn’t seem to be much evidence that many investors in the United States stock market are actively worrying today that other investors are on the verge of selling.”
Given the increasing number of warning signals, that is concerning.
Financial markets briefly softened in August and roared back in September, but appear to be have been turning a blind eye to the obvious for some time. The CBOE’s VIX, which measures volatility and is widely interpreted as a gauge of investor fear, fell to its lowest level ever this summer. It has since rebounded a bit, to about 12, but remains low compared to its historical average closing level of 19.
But the CBOE 3 Month Volatility Index (VXV) is trading at its highest level relative to the VIX since 2012. “Traders are bracing for equity turbulence sometime in one to three months but no earlier,” Joe Ciolli concluded in a Business Insider analysis of the gap. “And wouldn’t you know it: The three-month horizon perfectly captures both third-quarter earnings season and, perhaps most crucially, the government’s debt-ceiling deadline. Both events carry considerable event risk that could inject the market with some long-awaited volatility.”
Cash allocations in individual investors’ portfolios, an indication of how conservative their behavior is (or in this case, is not), rebounded by 1.5 percent in August –though still to a relatively low 16 percent- after having fallen to a more than 17 year low in July. But get this: “Even with the rebound, August was the 69th consecutive month that cash allocations were below their historical average of 23.5%,” the American Association of Individual Investors noted on its blog.
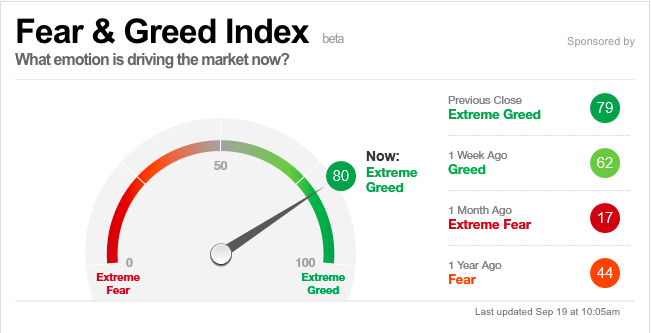
CNN Money’s Fear & Greed index has been all over the place, solidly indicating greed around 70 in early summer, dipping to a fear-driven level of 22 in mid summer, but on September 19 was firmly back in extreme greed territory, at 80.
Alongside this seemingly irrational exuberance –which itself is a red flag- investors have been all but ignoring key indicators.[bctt tweet=”Alongside irrational exuberance –itself a red flag- investors have been ignoring key indicators.” username=”@wucker”]
Short interest –an indicator of how strongly investors are betting on a market downturn- hit a three year low at the end of 2016. Since then, short interest ratios for both the NYSE and NASDAQ have risen steadily. The next set of numbers are due out September 27 and should make for interesting reading.
The economic fundamentals behind both the stock and bond markets also are worrisome.
Corporate debt is way up, both in absolute numbers and relative to companies’ ability to pay. Energy, utilities, and materials stocks have raised debt to earnings ratios in the S&P 500 Index to new highs.
In April, the International Monetary Fund warned that more and more U.S. companies are showing signs of financial distress. Despite low rates, more than one in five could have trouble paying interest out of current earnings. [bctt tweet=”More than 1 in 5 US companies could have trouble paying interest from current earnings, per IMF.” username=”@wucker”]. This certainly explains why the number of credit downgrades is rising.
The IMF pointed mainly to the energy sector but warned that the number of “challenged” firms was spreading to utilities and real estate. And it sounded the alarm about markets’ apparent oblivion, warning that a “swift repricing” could be in order.
Don’t say nobody said they didn’t see a gray rhino on the horizon. Or, as Taylor Swift would put it: Don’t say I didn’t say I didn’t warn ya (say I didn’t warn ya
- The Gray Rhino Wrangler on Substack - January 1, 2025
- Gray Rhino Risks and Responses to Watch in 2024 - January 10, 2024
- In the Media 2023 - December 31, 2023


